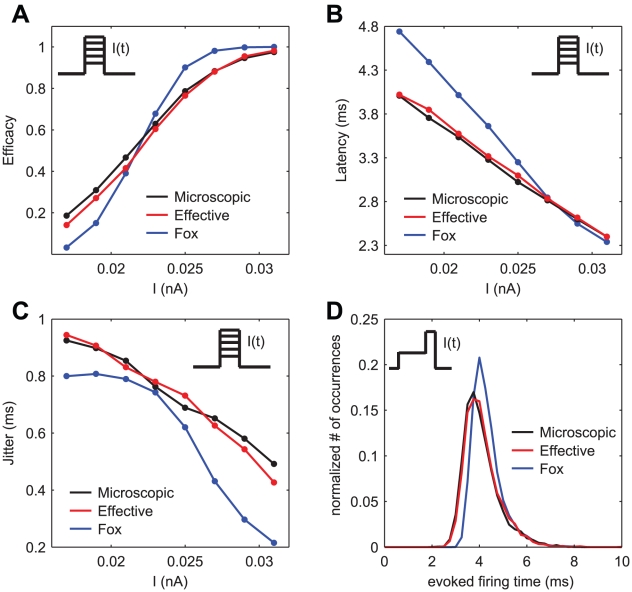
Figure 5. Comparison of firing efficacy, latency and jitter of a sharp current pulse.
Panels A, B and C display the firing efficacy, the average latency and the jitter of the evoked responses, respectively, after the application of a monophasic stimulus of duration  repeated for 10000 trials. Black and red traces and dots result from the simulations of the exact kinetic schemes and from our diffusion approximation, and in blue we indicate the results from the simulation of the Langevin-approximation introduced by Fox. Panel D shows the distribution of spike occurrence times, evoked by a biphasic stimulus over 10000 trials: the duration and amplitude of the preconditioning part are
  and
and  , respectively, the duration and amplitude of the second part are
  and
and  . In all panels, the neuron is simulated as a single cylindrical compartment of length and diameter equal to
  and single channel conductances equal to
  , for both sodium and potassium channels. The integration time step was set to
  .
.

