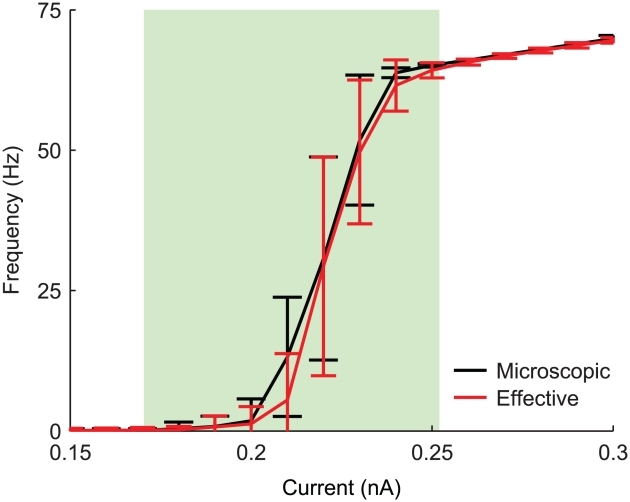
Figure 7. Frequency-current ( ) response curves.
Mean firing rate, in response to a DC current injection, studied for increasing stimulus intensities in both Montecarlo microscopic (black trace) and effective model (red trace) simulations. Single-channel conductance for both sodium and potassium channels set to  .
.

