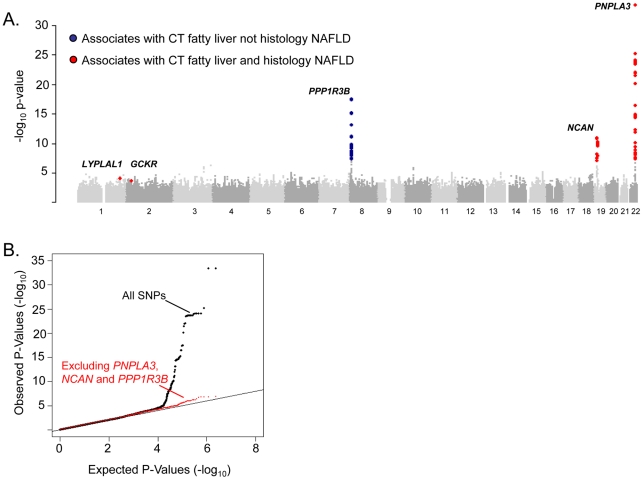
Figure 2. Genome-wide association results for GOLD (Stage 1).
A. Manhattan plot showing the significance of association of all SNPs in the Stage 1 GOLD meta-analysis with CT hepatic steatosis. SNPs are plotted on the x-axis according to their position on each chromosome against association with CT hepatic steatosis on the y-axis (shown as -log10 p-value). SNPs that also associate with histology based NAFLD are in red, those that only associate with CT hepatic steatosis in blue. B. Quantile-quantile plot of SNPs after Stage 1 GOLD meta-analysis (black) and after removing any SNPs within 500 kb of PNPLA3, PPP1R3B, and NCAN (red).

