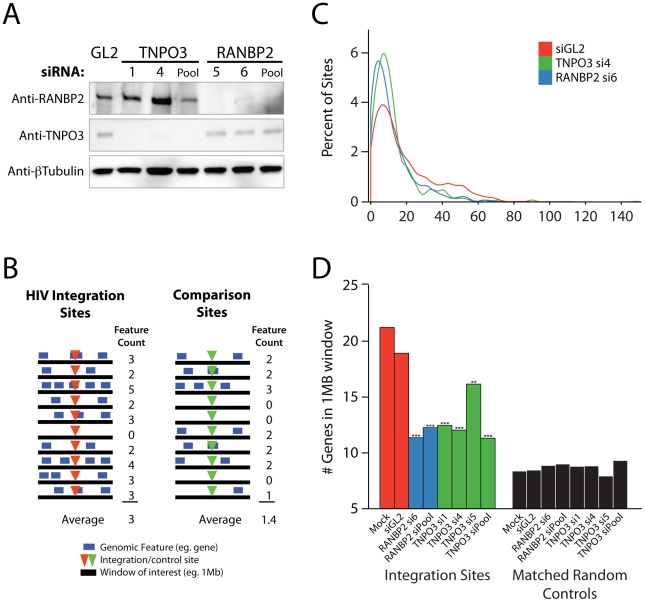
Figure 1. Effects of siRNA treatments on HIV integration in gene dense regions.
Cells were transfected with individual siRNAs or an siRNA pool of four siRNAs targeting the same gene as indicated, and infected 48 hr later for an additional period of 48 hr prior to integration site analysis. (A) Reduction in Transportin-3 and RanBP2 protein levels after RNAi. Protein abundance was measured at the time of infection by Western blot with β-tubulin as a loading control. For comparison, protein levels are shown in cells treated with an siRNA against firefly luciferase (GL2), a gene not found in HEK-293T cells. (B) Overview of the approach for integration site analysis. The number of genomic features of interest (blue bars), such as transcription units, is tabulated within genomic intervals (black bars) surrounding integration sites (red arrowheads) or computationally-generated matched random control sites (green arrowheads). The average number of times the genomic feature occurs within that window can be compared across datasets. (C) Histogram indicating distribution of integration sites with respect to gene density. Cells were transfected with individual siRNAs and infected as above. Sample names in legend indicate the gene targeted followed by the individual siRNA number. The number of genes in 1 Mb windows surrounding each integration site was counted as in 1B. Integration sites in each dataset were binned (along the X-axis) according to the number of genes within 1 MB interval surrounding each site. Curves were computed from histogram plot using Gaussian kernal density estimates. (D) Barplot of the average number of RefSeq genes in 1 Mb windows surrounding sites of HIV integration or computationally generated matched random controls. Mock transfected cells (no RNAi) and cells treated with the siRNA targeting luciferase GL2 (siGL2) are shown as controls. Asterisks denote significant difference from control GL2 siRNA treated cells as determined by the nonparametric Mann–Whitney test (*P<0.05; **P<0.01; ***P<0.001).

