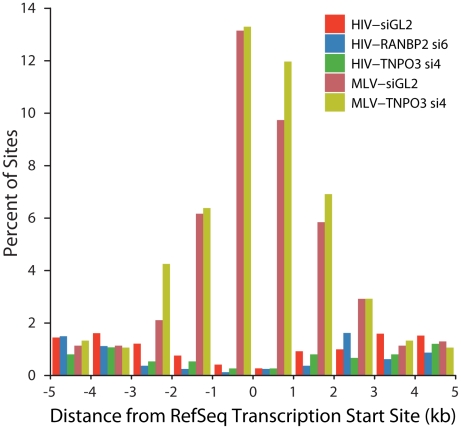
Figure 8. HIV and MLV integration patterns at transcription start sites are unaffected by knockdown of TNPO3 or RANBP2.
The percent of integration sites within the indicated genomic distances (kb) from the transcription start site (RefSeq genes) is plotted for each dataset. Sample names indicate the VSVG-pseudotyped viral vector used (HIV or MLV) followed by the cell treatment (either control siGL2 or gene-specific siRNA used).

