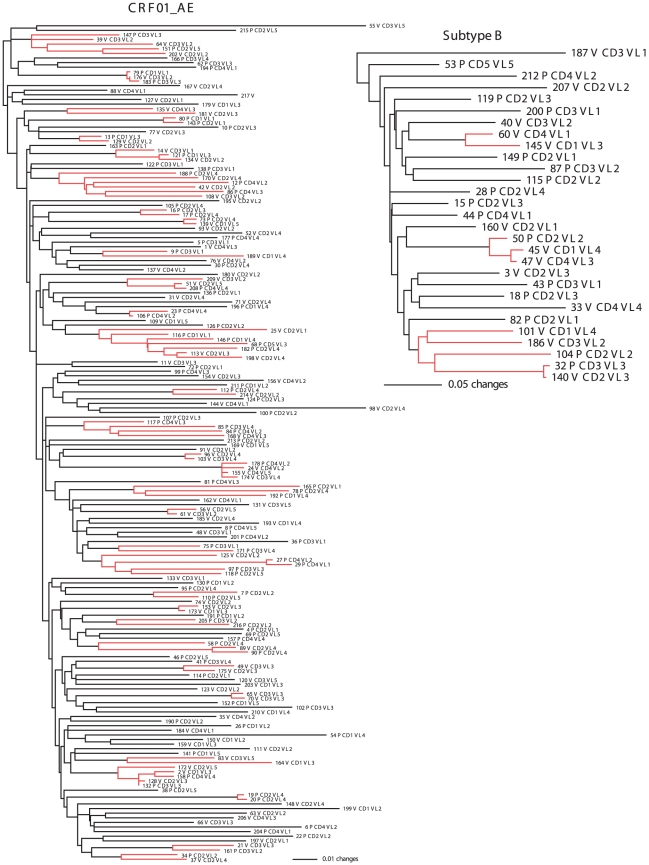
Figure 1. HIV-1 subtype phylogenetic trees.
Maximum likelihood phylogenetic inference of Bangkok HIV-1 CRF01_AE and subtype B population structuring as a function of treatment [placebo (P) and vaccine (V)], viral load (VL), and CD4+ counts. Branch lengths are shown proportional to the amount of change along the branches. Clades supported by bootstrap proportions ≥70% and posterior probabilities ≥0.95 in the Bayesian analysis (transmission chains) are shown in red color and their terminals in bold. Only one clone per isolate (numbered) is represented for simplicity.

