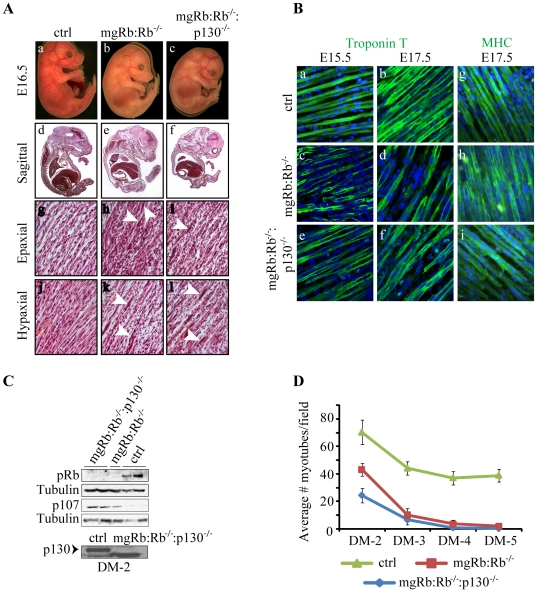
Figure 1. Analysis of myogenesis mgRb:Rb−/−:p130−/− double mutant embryos.
(A) Appearance of ctrl, mgRb:Rb−/− and mgRb:Rb−/−:p130−/− embryos at E16.5 (a–c). Hematoxylin & eosin (H&E) histology staining reveals the cellular morphology at mid-sagittal section (d–f), epaxial muscles (g–i) and hypaxial muscles (j–l). Arrowheads point to enlarged nuclei within myofibers. (B) Confocal images showing fast troponin T (green) expression in skeletal muscle sections of control (ctrl) (a–b) mgRb:Rb−/− (c–d) and mgRb:Rb−/−:p130−/− (e–f) embryos. MHC (green) expression in skeletal muscle sections of ctrl (g) mgRb:Rb−/− (h) and mgRb:Rb−/−:p130−/− (i) embryos. DAPI was used to counter-stain nuclei (blue). (C) Top, western blot analysis for pRb and p107 in DM-2 ctrl, mgRb:Rb−/− and mgRb:Rb−/−:p130−/− myoblast cultures. Tubulin was used as loading control. Bottom, western blot analysis of p130 in DM-2 ctrl and mgRb:Rb−/−:p130−/− cultures. Arrow indicates location of p130. Lower band represents a splice variant or cross-reactive protein. (D) Average number of myotubes counted on indicated days post-differentiation. Each time point represents an average ± s.d. of 6 fields at 200X (n = 4).

