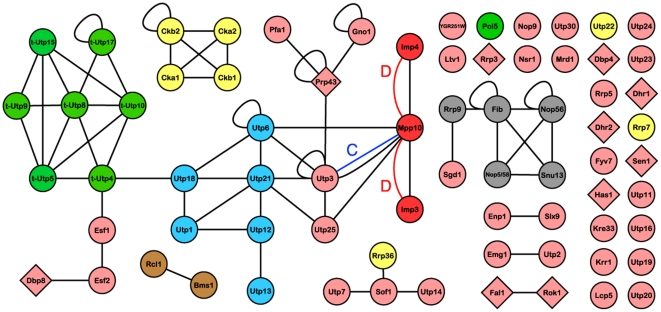
Figure 4. The current, merged SSU processome interactome map from the three HT-Y2H, PCA, LC and interologue datasets.
Interologues identified in Drosophila (D) [6] and C. elegans (C) [10] are also shown, with red and blue edges, respectively. The PPI redundancy (same interactions identified by different studies, methods or reciprocally) was removed from the figure to highlight the interacting partners. Nodes are depicted as in Fig. 1. Standalone nodes depict proteins without interaction data from any of the compiled datasets.

