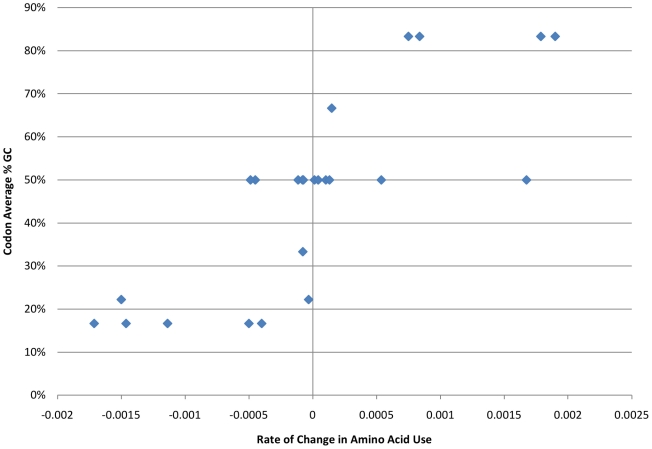
Figure 5. Average of the slopes for all 20 amino acid codon families (with the six-fold degenerate amino acid codon families being divided into two groups based on the first position nucleotide) for all eight groups plotted against the average GC content of their respective codons.
For each class or phylum, the frequency of each amino acid in the coding portion of each genome was plotted against the genomic GC content of the genome. The slopes of these eight plots were then averaged and plotted versus the average GC content of the codon family for each amino acid.

