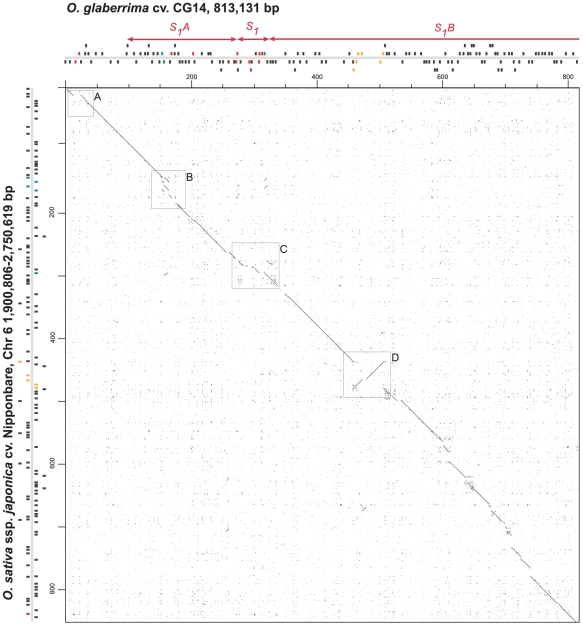
Figure 3. Orthologous sequence comparisons between the 813 kb and 847 kb from the O. glaberrima cv. GC14 and O. sativa ssp. japonica cv. Nipponbare S1 regions.
Comparisons were performed using dot plot alignment of the CG14 sequence (horizontal axis) against the Nipponbare sequence (vertical axis; coordinates 1,900,806–2,750,619-bp on chromosome 6). The S1A, S1 and S1B regions are indicated along the horizontal axis. Positions and orientation of genes are symbolized by black and colored boxes along X and Y-axes. Colored boxes represent genes that disrupted microcollinearity. Clear boxes in the dot blot underline four large regions showing a strong disruption in the microcollinearity.

