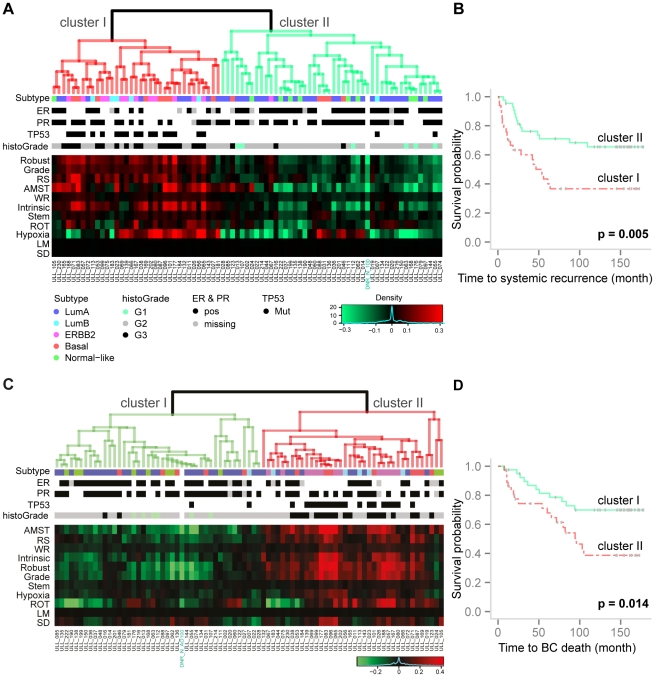
Figure 3. Hierarchical clustering of predicted PIs on test set and Kaplan-Meier analysis of the clusters.
Results for systemic recurrence are in (A–B); for BC specific death in (C–D). In heatmaps (A, C), rows are notations for the gene sets. Columns are annotation for the patients; data outside of 1% quantile were trimmed. “Average” linkage based on Spearman correlation was used to construct the dendrograms. Figure A and C share legends for the clinical parameters. (A) Heatmap of predicted PIs on the test set for systemic recurrence from each gene sets. Two risk groups were observed from the hierarchical clustering; cluster I and cluster II. The control sample in Ull DNR_N_100, marked by green, was classified in the cluster associated with a lower risk (cluster II). (B) The Kaplan-Meier curves for the two clusters. A significant separation between the two groups was observed (χ2 = 7.8, df = 1, p = 0.005). (C) Heatmap of predicted PIs on the test set for BC specific death from each gene sets. Two risk groups were observed from the hierarchical clustering; cluster I and cluster II. The control sample in Ull DNR_N_100, marked by green, was classified in the cluster associated with a lower risk (cluster I). (D) A significant separation between the two Kaplan-Meier curves associated with the clusters was observed (χ2 = 5.996, df = 1, p = 0.014).

