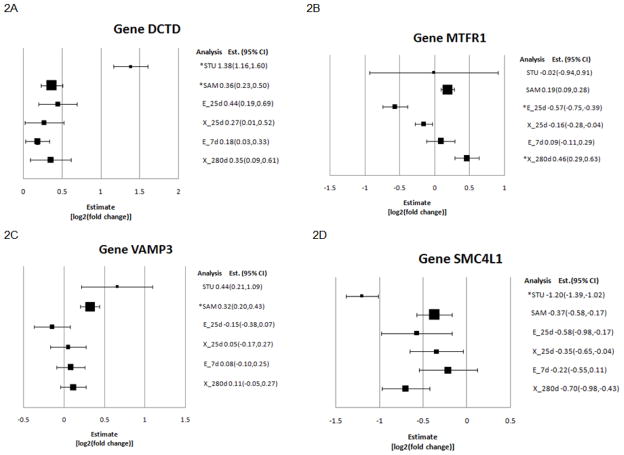
Figure 2.
Funnel plots of differential expression estimates (square) and 95% confidence interval limits (horizontal line) for genes deoxycytidylate deaminase (DCTD), mitochondrial fission regulator 1 (MTFR1), vesicle-associated membrane protein 3 (VAMP3), and structural maintenance of chromosomes 4-like 1 (SMC4L1), by individual-experiment, study-level (Study), and sample-level (Sample) meta-analyses. STU denotes study-level meta-analysis of standardized estimates, SAM denotes sample-level meta-analysis, and the individual-experiment analyses are denoted: d25X (25 d extra-embryonic samples), d25E (25 d embryonic samples), d280X (280 d extra-embryonic sample and d7E (7 d embryo samples). The size of the square denoting the estimate corresponds to the number of observations in the experiment (d25X n=12; d25E n=11; d280X n=29; d7E n=29; STU n = 4; SAM n = 89). Analyses detecting significant (P-value <1×10⁻³, fold change > 1.23) differential expression between AI and NT samples are denoted by an asterisk.

