
Figure 1.
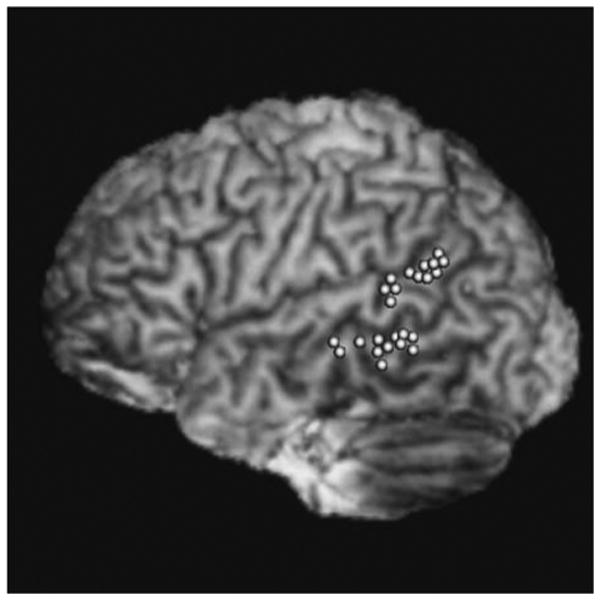
Stimulation locations for each subject in this study, transformed to a common atlas space (ICBM 452) for display purposes. Average MNI coordinates for the pSTG stimulation were −64, −38, −13, and for the MTG, −69, −39, −2.
Official websites use .gov
A
.gov website belongs to an official
government organization in the United States.
Secure .gov websites use HTTPS
A lock (
) or https:// means you've safely
connected to the .gov website. Share sensitive
information only on official, secure websites.
Stimulation locations for each subject in this study, transformed to a common atlas space (ICBM 452) for display purposes. Average MNI coordinates for the pSTG stimulation were −64, −38, −13, and for the MTG, −69, −39, −2.