
Figure 2.
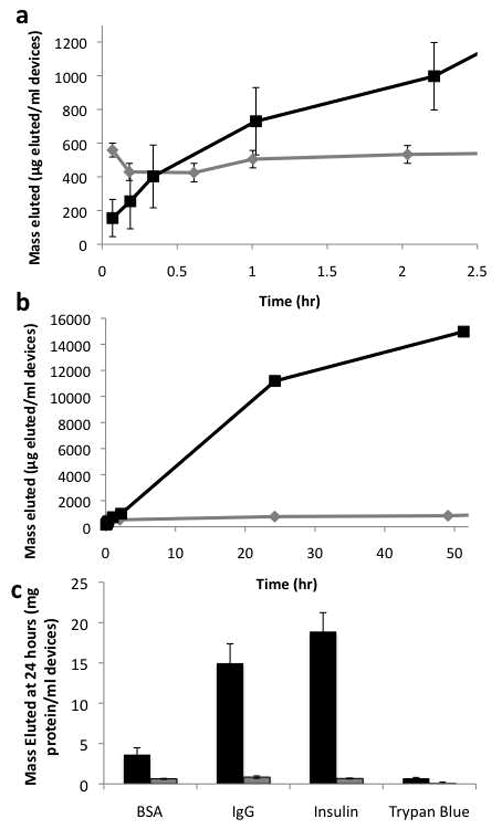
Elution from controlled pore glass devices. A) and B) Elution of IgG from nanowire-coated devices (black) and uncoated devices (gray) for 2.5 hours (A) and 48 hours (B). C) Total elution at 48 hours. Nanowire-coated devices – black, uncoated devices – gray. Error bars on all plots are standard error of the mean.