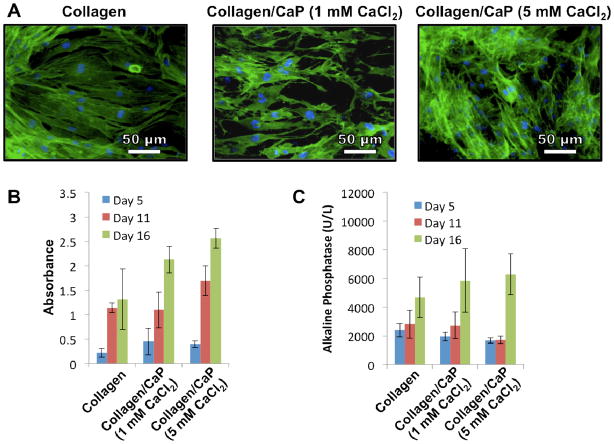
Figure 4.
(A) Fluorescent microscopy images of hADSCs cultured on different fibrils in which green indicates actin filaments and blue indicates cell nuclei; (B) Results as a function of time of the CellTiter 96® assay indicating proliferation of hADSCs on collagen fibrils; (C) Alkaline phosphatase production from hADSCs cultured on collagen fibrils as a function of time. The CaCl2 concentrations refer to the concentrations in the feed solution.

