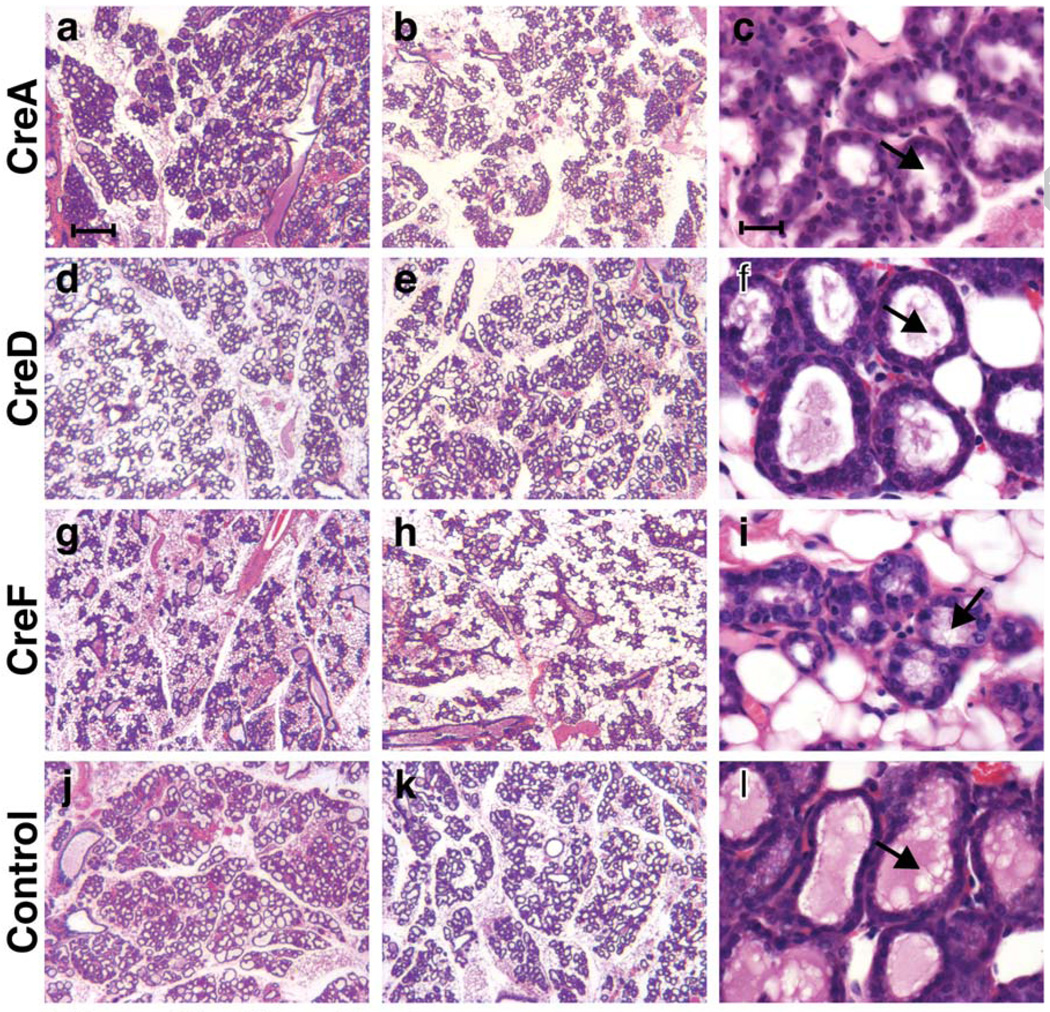
Figure 2. Alveolar development in MMTV-Cre strains.
Representative areas of on H&E stained sections of mammary tissues collected at term from CreA (a – c), CreD (d – f), CreF (g – i) and wild type (j – l) mice are shown. Low magnification images of two mice from each line (least and most developed) are shown to illustrate mouse-to-mouse variation and regional heterogeneity (left 2 panels). Mammary epithelial cells appear morphologically differentiated at higher magnification in lines CreA (c), CreD (f), CreF (i) and controls (l) (right panel row). The lumina are filled to varying extent with proteinaceous material and milk fat globules (arrows). Scale bar = 150 min a, b, d, e, g, h, j and k; 10 min c, f, i and l.

