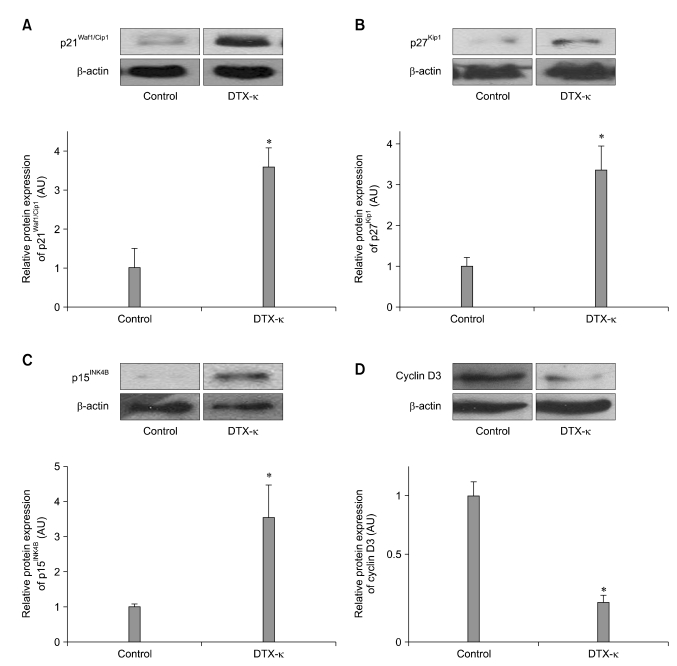
Fig. 4.
Increased protein expression of p21Waf1/Cip1, p27Kip1, and p15INK4B and decreased protein expression of cyclin D3 upon treatment with DTX-κ. This figure shows a representative image from Western blot analysis and relative protein expression levels of p21Waf1/Cip1 (A), p27Kip1 (B), p15INK4B (C), and cyclin D3 (D). The protein expression levels were normalized to that of β-actin. Furthermore, data were normalized to the values obtained for the control group and presented as means ± SE (control group: n = 2, DTX-κ group: n = 6; *p < 0.05).

