Figure 5.

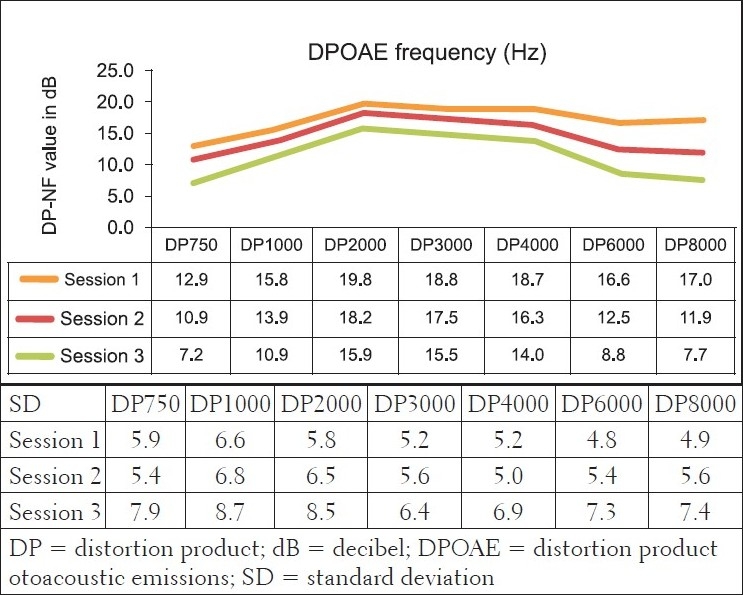
Mean bilateral DPOAE results (in dBSL) and their standard deviations for the group with normal PTA at the three different sessions (n=90 ears)

Mean bilateral DPOAE results (in dBSL) and their standard deviations for the group with normal PTA at the three different sessions (n=90 ears)