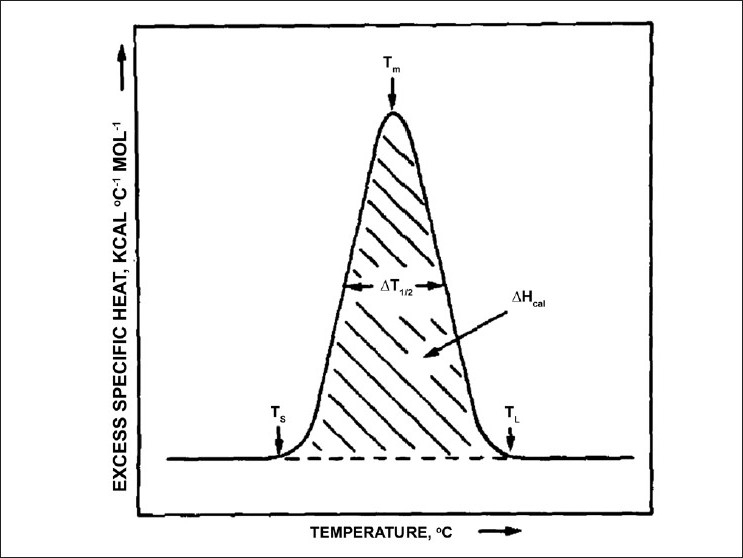
Figure 2.

Enthalpy, T1/2 and Tm shown on a DSC endotherm. Reprinted from Chemistry and Physics of Lipids, Vol. 30, R.N. McElhaney, The use of differential scannning calorimetry and differential thermal analysis in studies of model and biological membranes, 229-259, 1982, with permission from Elsevier
