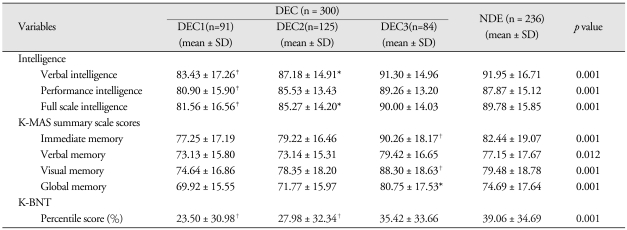
Table 7.
Comparisons of intelligence quotients, K-MAS index scores and K-BNT score among DEC and NDE groups
*p < 0.05, †p < 0.01, ‡p < 0.001, p value of Dunnett's t-test. N : numbers of patients, DEC : clustered disability evaluation group, NDE : non-disability evaluation group, SD : standard deviation

