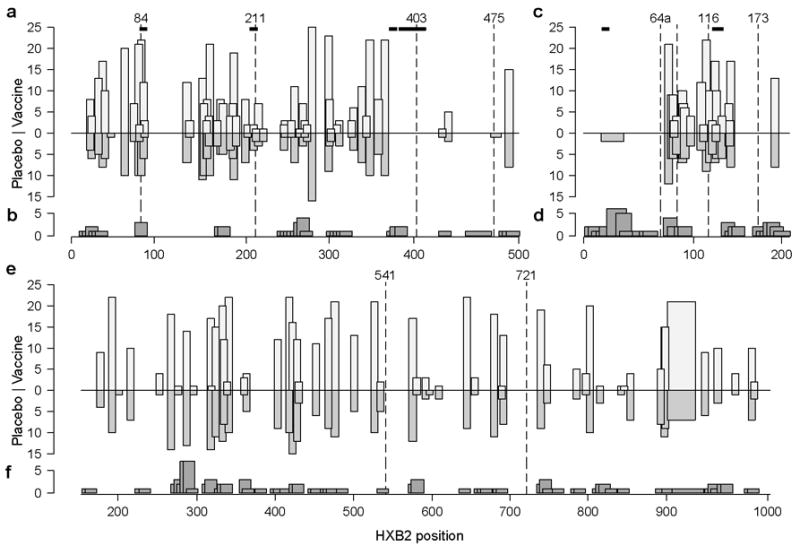
Fig. 5. Summary of sequence analyses and IFN-g ELISpot data from Gag (a,b), Nef (c,d) and Pol (e,f).

For each protein, the upper panel (a,c,e) represents the location of predicted epitopes based on NetMHC in vaccine and placebo groups (light and medium gray columns, respectively), amino acid signature sites (dashed lines), and signature k-mers (horizontal bars). The lower panel (b,d,f) corresponds to IFN-γ ELISpot responses detected in 21 vaccine recipients prior to infection. 15mer peptides overlapping by 11 amino acids were used to assess responses. The region covered by each responsive peptide is shown as the box width, whereas the number of subjects reacting with that peptide is given by the box height.
