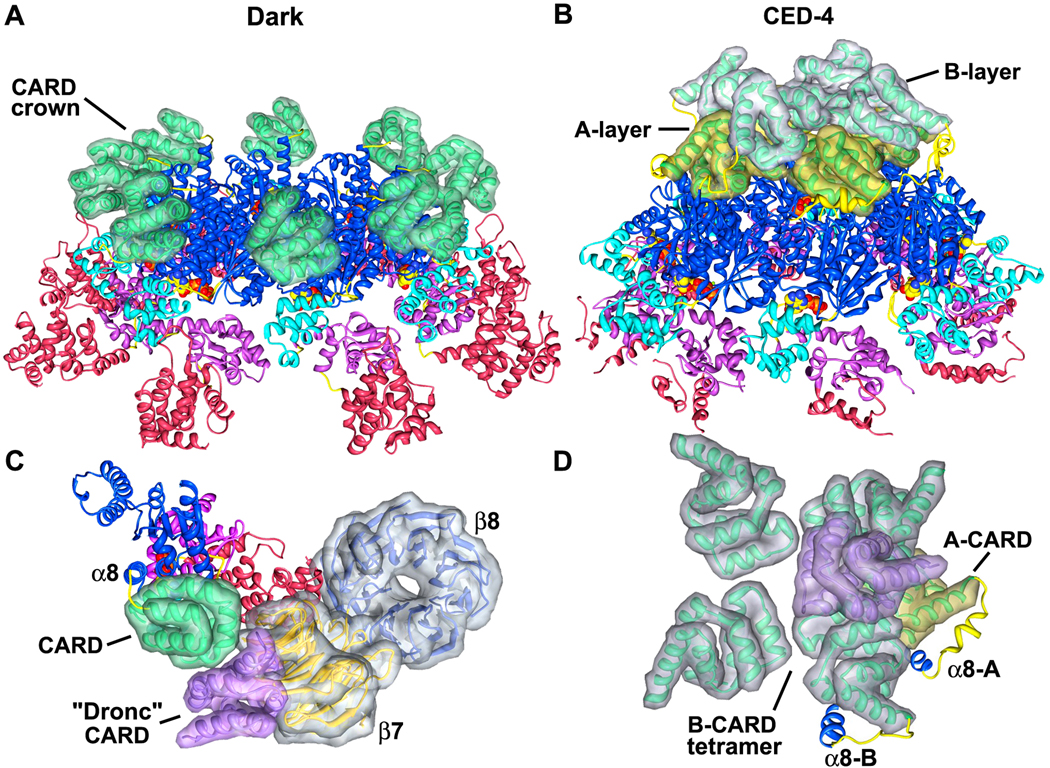
Figure 8. The presentation of CARDs on Dark and CED-4 apoptosomes.
A. A tilted view is shown of the central Dark hub. The 8 CARDs in the crown are shown within calculated surfaces to provide better depth perception.
B. A tilted view is shown of the CED-4 apoptosome with CARDs from the A- and B-subunits displayed within calculated surfaces. The tetrameric A-layer is shown in gold and B-layer is in silver.
C. A strong clash exists between the bound CARD of the initiator procaspase (in purple) and the β-7 propeller of Dark. A monomer is shown and domains are displayed within calculated surfaces.
D. This panel shows the relative orientations of A- and B-CARDs in two layers on the CED-4 apoptosome. Only CARDs and α8 helices are shown for clarity. The modeled binding of an initiator CARD (in purple) by a CED-4 CARD in the B-layer would preclude the binding of other initiator CARDs and shows significant clashes.

