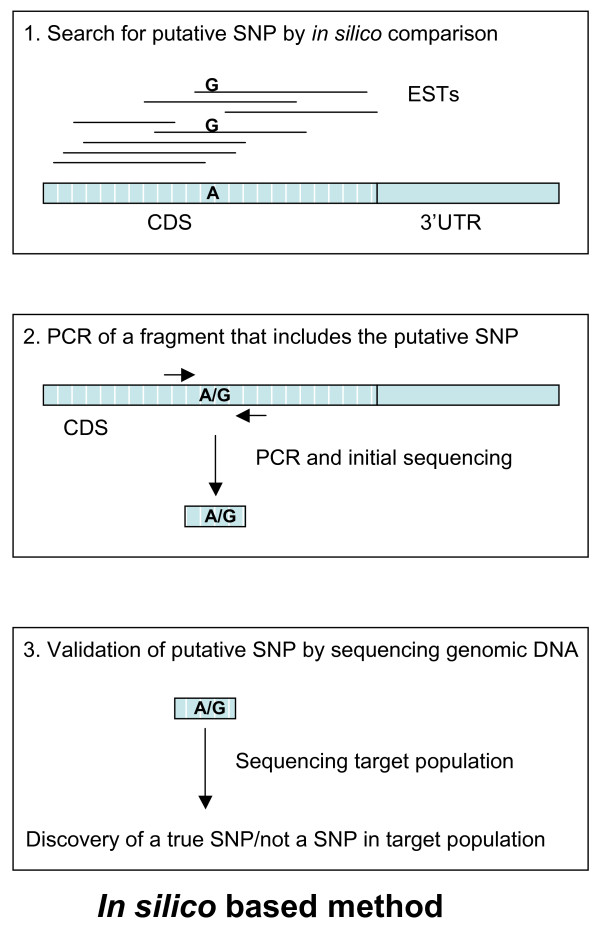
Figure 2.
The figure shows the three main steps of the in silico method. Step 1 illustrates alignment of ESTs to the FLIcs from the target gene. This is the step where putative SNPs could be identified. Step 2 shows the PCR and initial sequencing step where a fragment that included the putative SNP was amplified and sequenced. Step 3 illustrates the sequencing of the PCR fragment from step 2 in all individuals in the target population to validate the putative SNP as a true SNP.

