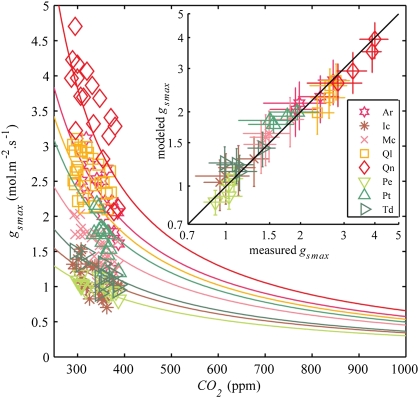
Fig. 2.
Modeled structural adaptations of gsmax to CO2 for each species (solid colored lines), compared with measured gsmax averaged at each measured CO2. Inset shows a direct comparison between modeled and measured gsmax averaged over CO2 quartiles of the data. Error bars indicate SDs of modeled (vertical) and measured (horizontal) gsmax in each quartile.

