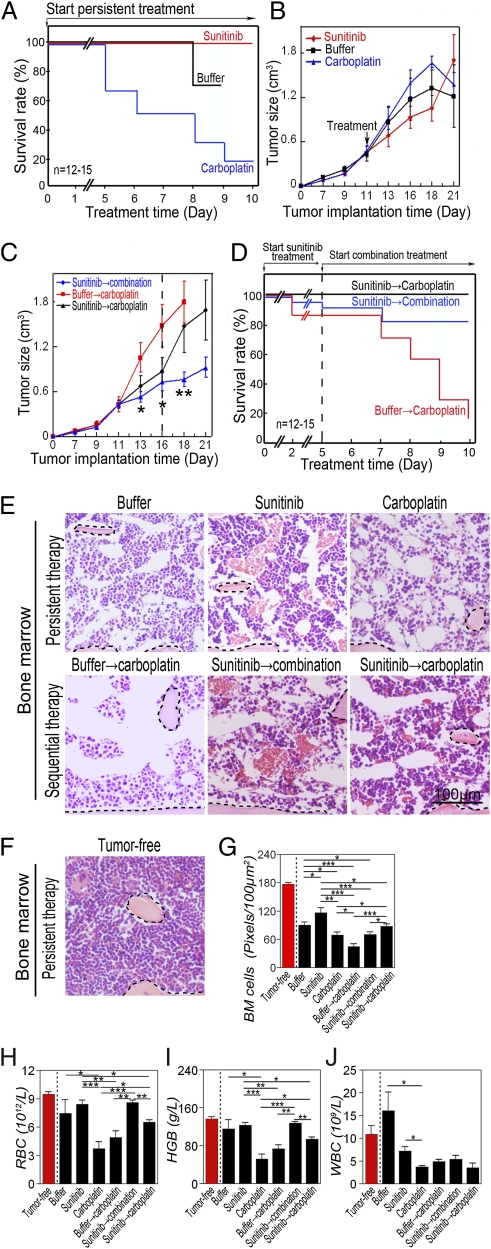
Fig. 1.
Improvement of survival in a murine melanoma model. (A) Treatment of B16 melanoma-bearing mice (n = 12–15 mice/group) with sunitinib, carboplatin, or vehicle was started when the average tumor size reached 0.4 cm3. Survivals of mice were closely monitored several times per day. (B) Tumor growth rates of sunitinib-, carboplatin-, or vehicle-treated groups (n = 12–15 mice/group). (C) When the average tumor size reached 0.4 cm3, tumor-bearing mice (n = 12–15 mice/group) were treated with sunitinib. At day 6 after treatment, sunitinib-treated mice received carboplatin or carboplatin plus sunitinib until the end of experiments. Vehicle-pretreated group followed by carboplatin was used as a control. (D) Kaplan–Meier survival curve of various treated groups under the regimen described in C. Dashed line marks pretreatment endpoint. (E and F) BM histology of various treated groups described in A–D. Dashed lines enclose bone matrix. (Bar = 100 μm.) (G) Quantification of density of BM cells (20× magnification, eight randomized fields per group). (H–J) RBC (H), hemoglobin (I), and WBC (J) in peripheral blood. *P < 0.05, **P < 0.01, ***P < 0.001. Data are shown as mean ± SEM.

