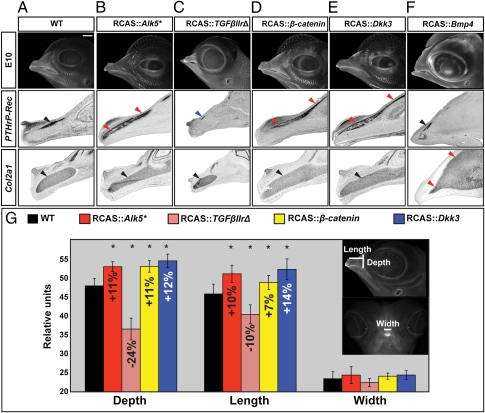
Fig. 3.
Functional analysis of TGFβIIr, β-catenin, and Dkk3 in the chicken model system. (A–F) UV pictures of embryonic day 11 (HH st. 37). (A) Wild-type chicken embryos and embryos infected with (B) RCAS::Alk5*, (C) RCAS::TGFβrΔ, (D) RCAS::CA-β-catenin, (E) RCAS::Dkk3, and (F) RCAS::Bmp4 constructs. We used PTHrP-Rec and Col II probes to reveal early osteoblasts (PTHrP-Rec) and chondrocytes (Col2a1) (also see Fig. S3). Blue arrows indicate lower expression relative to wild-type specimens, red arrows indicate higher expression, and black arrows indicate no change. (G) Histogram showing beak variation in wild-type and RCAS-infected chicken embryos. Embryos infected with RCAS::Alk5* (n = 8), RCAS::TGFβrΔ (n = 9), RCAS::CA-β-catenin (n = 9), and RCAS::Dkk3 (n = 15), showed a significant change in their depth and their length relative to wild-type controls (n = 9), whereas the width remained (asterisks denote significance at P < 0.05, t test; error bars represent SD values). (Scale bars: 200 mm in whole-head images and 0.4 mm in sections A–F.)

