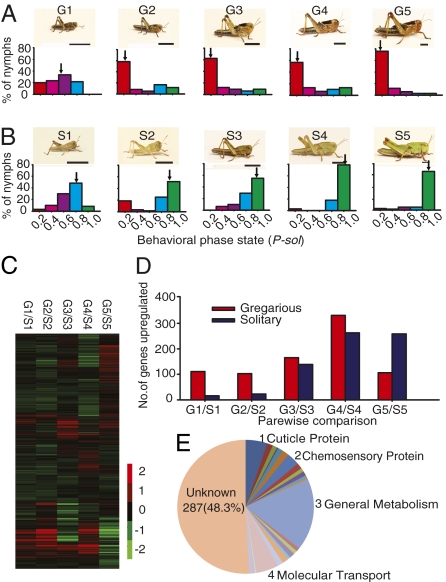
Fig. 1.
Phenotype-associated pattern and genome-wide expression profile. (A and B) Typical gregarious (A) and solitary (B) nymphs and the distribution of P-sol values in each population are shown. Arrows indicate median P-sol values. (Scale bars = 5 mm.) (C) Heat map of all genes in the five comparisons between the two phases. (D) The number of DEGs identified in five stadia. (E) Gene classification of 594 DEGs from the fourth-stadium comparison. S, solitary phase; G, gregarious phase; 1–5, nymph stadia 1–5.

