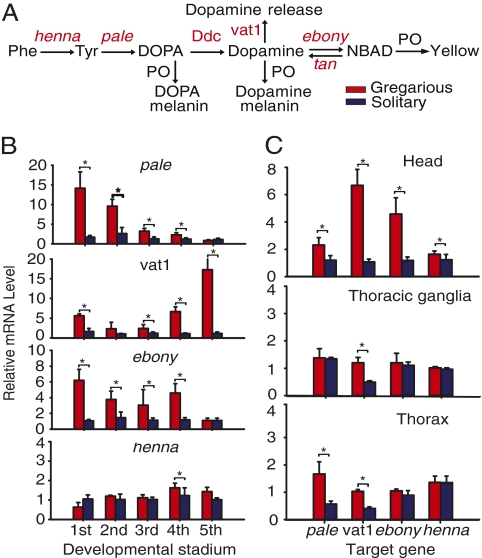
Fig. 2.
Temporal and spatial expression of genes related to dopamine metabolism show phase-specific expression patterns. (A) Schematic representation of dopamine metabolic pathway. NBAD, N-β-alanyldopamine. (B and C) Quantitative PCR analyses of pale, ebony, vat1, and henna expression in gregarious and solitary phases were performed at different intervals throughout the stadium (B) or in different tissues (C). Levels of gene expression in solitary nymphs are shown in blue, and levels of gene expression in gregarious nymphs are shown in red. Asterisks denotes statistically significant change (mean ± SE; P < 0.05, Student t test).

