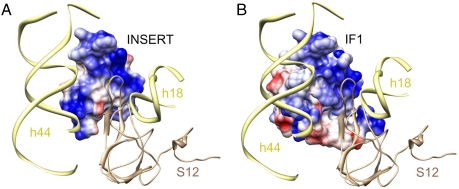
Fig. 5.
Comparison of surface charge distribution on IF1 and the 37-aa insertion domain of IF2mt. (A) Insert of IF2mt, and (B) IF1. Both the insert and IF1 are shown in matching orientations with respect to their common binding pocket on the 30S subunit. Blue and red patches reflect positive and negative surface charge potentials, respectively. Landmarks are same as in Fig. 4.

