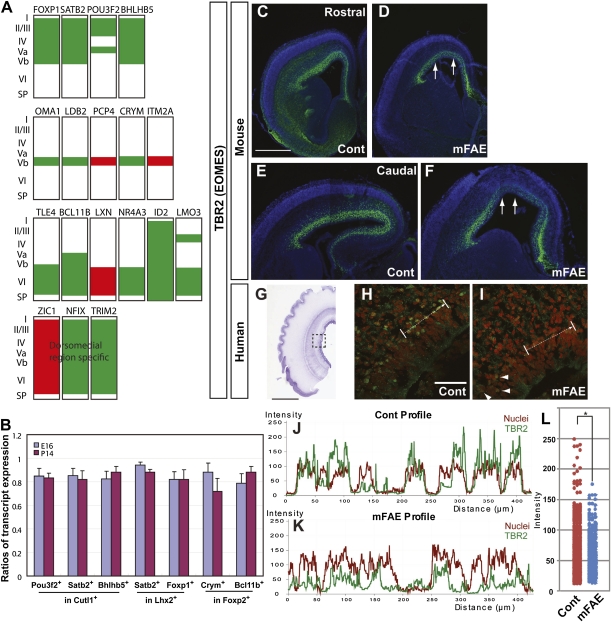
Fig. 3.
Molecular identities of neuronal subtypes were altered by mFAE. (A) Schematic diagrams showing up- (red) and down-regulation (green) of cortical layer and/or region-specific genes in the embryos exposed to ethanol. Expression patterns of the markers were depicted on the basis of previous reports (32–35). (B) The fractions of cells expressing the enriched (as altered expression by mFAE in microarray analysis) genes in cells expressing the reference nonenriched genes were calculated using the data obtained by flow cytometric analysis (Fig. S5C). The ratios of the corresponding fractions in mFAE vs. control-treated samples (set to 1.0) were presented for E16 and P14 (the mean ± SEM from the experiments using four dams per condition). P < 0.05 by Mann–Whitney u test. (C–I) Tbr2 immunohistochemistry (green) in the control (Cont) and ethanol-exposed E16 mouse (C–F) and GW17 human cortex (H and I). The nuclei were counterstained with DAPI (4',6-diamidino-2-phenylindole) (blue or red). Arrows in D and F indicate the regions that contain cells with weaker Tbr2 expression in rostral (C and D) and caudal (E and F) cortical domains. The dotted square in the thionin-stained human cortex (G) depicts the region presented at higher magnification in H and I. The wavy pial surface is an artifact introduced during the staining process. Arrows in H and I indicate the domain used to calculate the intensity of immunostaining shown in J and K. (J and K) Decreased intensity of TBR2 immunolabeling (green lines) concomitant with increased intensity of nuclear labeling (red lines) in neural precursors that show irregular distribution in the ethanol-exposed human cortex. (L) Dot plots of TBR2 labeling intensity in human samples. The labeling intensity was measured every 0.2 μm along the total length of 200 μm. P = 0.002 by Mann–Whitney u test. n = 8/8 mouse embryos from four dams, and 8/8 cultured slices from four human fetuses. Arrowheads in I indicate the cells showing relatively normal intensity of TBR2 immunolabeling in the region adjacent to the affected region. [Scale bars, 2 mm (C–F), 20 mm (G), and 0.2 mm (H and I).]

