Fig. 5.
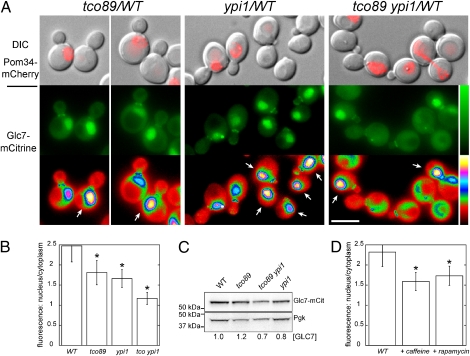
Tco89 is required for the normal nuclear localization of Glc7. (A) Subcellular distribution of Glc7-mCitrine in WT (KT3252), tco89-71 (KT3245), YPI1-GFP (KT3247), and tco89-71 YPI1-GFP (KT3250) strains at log phase in YPD medium grown at 30 °C. WT and mutant cells were imaged in the same field and distinguished by Pom34-mCherry fluorescence in the mutant cells. (Top panels) Fluorescence images of Pom34-mCherry overlaid on differential interference contrast (DIC) images. (Bottom and Middle panels) Fluorescence images of Glc7-mCitrine. The images in the lowest panel are displayed using a six-shade look-up table to better distinguish fluorescence levels between WT and mutant cells. (Scale bar: 5 μm.) (B) Quantitative analysis of nuclear and cytoplasmic Glc7-mCitrine fluorescence of cells (n ≥ 67 cells) imaged in A. The ratio of nuclear-to-cytoplasmic fluorescence is presented for each panel in A. Error bars, SD. Significantly different levels from WT, *P < 10−20, according to the unpaired Student's t test. (C) Immunoblot analysis with anti-GFP antibody of extracts from strains imaged in A. Glc7-mCitrine levels are relative to the loading control (Pgk1) and normalized to the WT. (D) Quantitative analysis of nuclear and cytoplasmic Glc7-mCitrine fluorescence in WT cells (KT3242) after treatment with 10 mM caffeine or 10 nM rapamycin. n ≥ 50 cells. Error bars, SD. Significantly different levels from YPD-grown control, *P < 10−19, according to the unpaired Student's t test.

