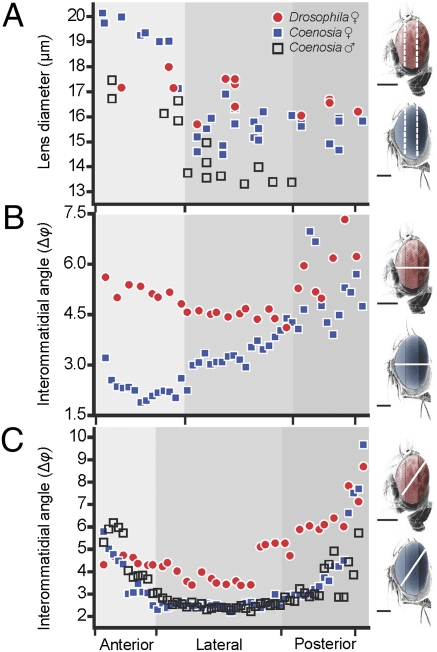
Fig. 2.
Lens diameter (D) and interommatidial angle (Δφ) across the eyes (miniature figures to the right indicate the sectioning plane used for each graph). (A) Eyes were divided into anterior, lateral, and posterior regions and the respective lens diameters measured from several locations for each region (n = 1 for each genotype). For each location, the mean distance (n = 5) between the center of neighboring lenses is plotted on the x axis, according to their estimated horizontal position. (B) Mean interommatidial angles from horizontal cuts of ♀ Coenosia and Drosophila. Coenosia have the smallest Δφ in the anterior (frontal) region (Δφ = 1.88°) (n = 2). (C) Even when the center of the acute zone is not sectioned (Fig. S2A), mean Δφ in Coenosia reach smaller values than Drosophila (n = 2 for each genotype). (Scale bars, 200 μm.)

