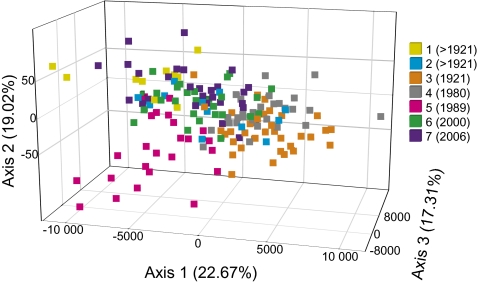
Fig. 2.
FCA of the genetic distances based on a plot using FST values of the individual strains belonging to the seven groups of strains established from resting stages in discrete sediment layers accumulated in Mariager Fjord from before 1921 to 2006 (samples 1–7 with approximate years when resting stages accumulated given in parentheses). Axes 1, 2, and 3 explain 59% of the variance in distribution of the individuals from the discrete sediment layers.

