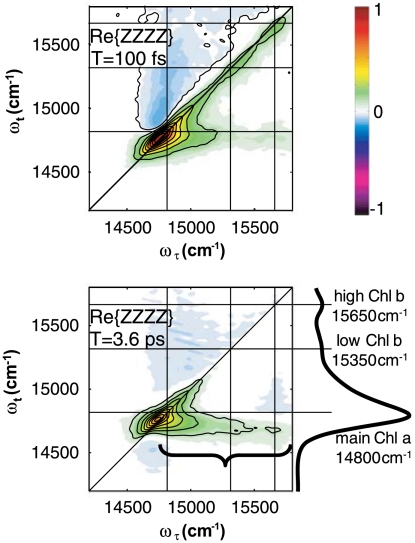
Fig. 2.
Absorptive ZZZZ 2D electronic spectra of CP29 at 77 K. Horizontal and vertical lines indicate the locations of the main Chl S0 → S1 transitions from the linear absorption spectrum adjacent to the T = 3.6 ps plot. The black brace highlights the cross-peak band indicating energy transfer to Chl a states. The T = 100 fs time point is scaled to its own maximum; for ease of comparison, the T = 3.6 ps spectrum is scaled to 3× the maximum of the  plot in Fig. 3.

