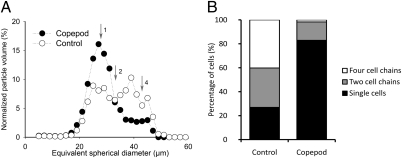
Fig. 1.
(A) Size distribution histograms of A. tamarense cultures grown with (solid symbols) and without copepod grazers (open symbols). The larger size of control cells is mainly caused by the higher prevalence of two- and four-cell chains compared with grazed treatments. The equivalent spherical diameters of one-, two-, and four-cell units are indicated by the numbered arrows. (B) The relative abundance of single cells and two- and four-cell chains from video observations of the same experiment.

