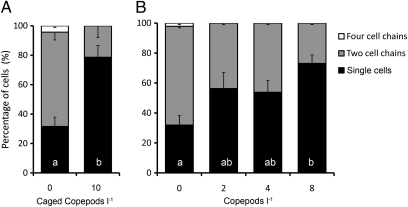
Fig. 2.
(A and B) Fraction of cells as single cells and two- and four-cell chains. (A) Control Alexandrium cultures and cultures exposed to waterborne cues from caged copepods. Bars denote mean values of four replicates ± SE of mean. Letters denote statistically different groups based on Student's t test (P < 0.05). (B) Alexandrium cultures exposed to zero, two, four, or eight copepods per liter without cages. Bars show mean values of three replicates and error bars show SE of mean. Letters denote statistically homogenous subsets according to the Student-Newman-Keuls post hoc procedure (P < 0.05).

