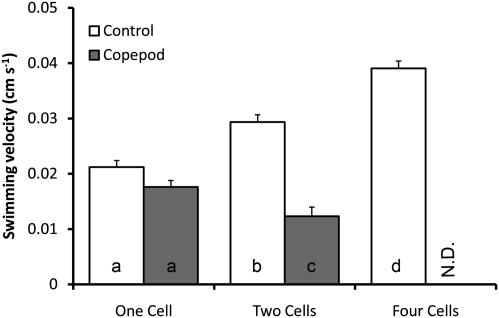
Fig. 3.
Swimming velocity of single cells and two- and four-cell chains in grazed and control treatments. Only one single four-cell chain was observed in the grazed treatment, and it is not included in the analysis (shown as N.D. in the graph). Bars show mean values + SE of mean based on the number of observations (Table 1). Letters indicate statistically homogenous subsets according to the Student-Newman-Keuls post hoc procedure (P < 0.05).

