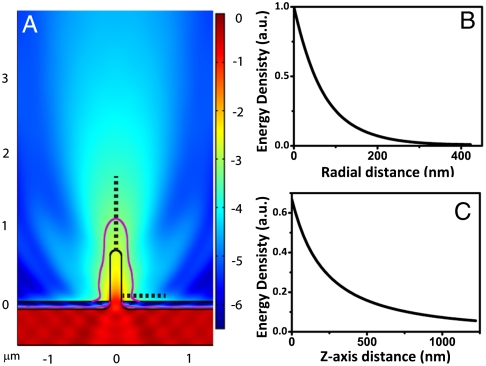
Fig. 2.
Illumination profile surrounding a nanopillar. (A) Finite-element analysis of the intensity distribution for a nanopillar of 150 nm in diameter and 700 nm long. Purple line indicates the contour of 1/e2 intensity (the intensity at the nanopillar surface 100 nm away from the platinum substrate is designated to be 1). (B) Plot of the light intensity as a function of radial distance along the horizontal dash line in A. The light intensity decays exponentially from the surface of the nanopillar. (C) Plot of the light intensity as a function of z distance along the vertical dash line in A. The light intensity decays more slowly along the z axis, penetrating approximately 500 nm from the tip of the nanopillar.

