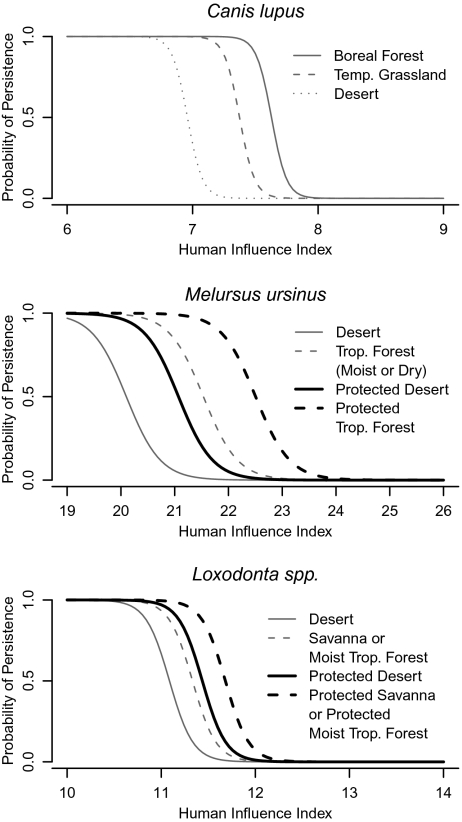
Fig. 2.
The relationship between the human influence index and the predicted probability of persistence varies as a function of biome and protection status. Curves are for the same three species in Fig. 1 and represent the most common biomes in the species’ historic ranges. Protected areas were not included for Canis lupus because they relationship with persistence was not significant in our models (Table S2).

