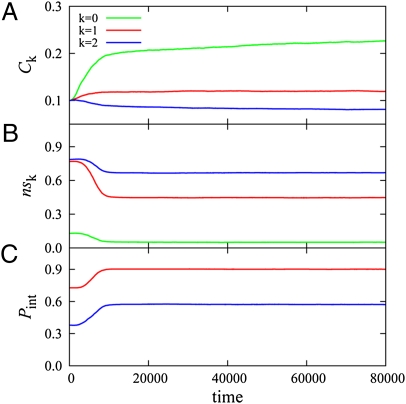
Fig. 2.
Evolution of protein abundances and PPIs after several rounds of preequilibration (Fig. S1). Green curves correspond to a functional monomer, the red curve is the average over two proteins forming a stable pair heterodimer (k = 1), and the blue curve corresponds to the average over three date triangle proteins (k = 2). (A) Mean concentration of each protein, Ci. (B) The fraction of protein material that is sequestered in nonfunctional interactions, nsi. (C) The strength of PPI in the functional complex, Pint, except the first protein that does not form any functional complex. All curves are ensemble averaged over 200 independent simulation runs.

