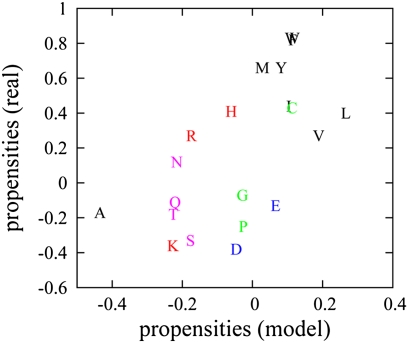
Fig. 3.
Scatter plot between amino acid propensities on functional interfaces of model and real proteins. We calculated the propensities for all model proteins from protein orthologs from 152 representative strains as described in Eq. S6. The propensities for real proteins are obtained from table 2 of ref. 9. The color scheme is as follows: black, hydrophobic; red, positively charged; blue, negatively charged; cyan, uncharged polar; and green, remaining amino acids.

