Fig. 5.
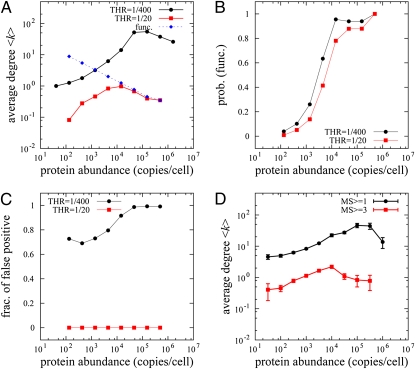
System-wide proteomics simulation of PPI detection and comparison with AC-MS high-throughput experiments. (A) Simulated AC-MS type of experiment in our model. We “designed” a set of 6,228 functional interactions among 3,868 proteins and assigned dissociation constants to all PPIs as described in Eqs. 5 and 6. The blue dashed line represents the average node degree of designed true PPIs and black and red solid lines correspond to the node degrees of captured PPI networks in our proteomics model at different values of the detection threshold. (B) The fractions of functional PPIs of all captured PPIs in our simulation at low (black) and high (red) thresholds are plotted as a function of protein abundance. (C) The fraction of detected PNF-PPIs of all captured PPIs. (D) The average degree of a protein in the S. cerevisiae PPI network vs. protein abundance. Black symbols correspond to all ∼28,800 AC-MS–labeled interactions in the BioGRID database, whereas red symbols correspond to ∼2,600 highly reproducible interactions confirmed in three or more independent experiments.

