Figure 4.
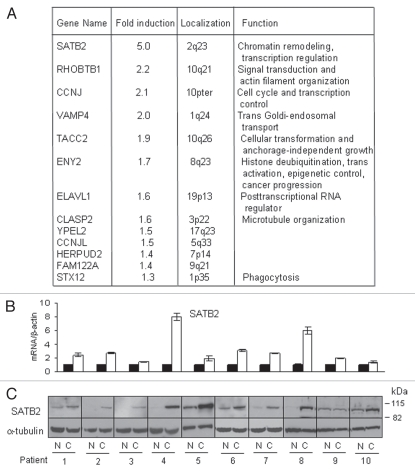
MiR-31-predicted target genes showed differential expression in CAFs. (A) Genes that matched TargetScan predicted genes in the list of genes generated by Significance Analysis of Microarray (SAM) method. Fold induction shows the ratio of expression in CAFs vs. normal fibroblasts. (B) Quantitative RT-PCR validations of SATB2 gene expression in ten pairs of fibroblasts. Black bars, NF; white bars, CAFs. Expression values for CAFs are presented relative to their respective NFs. (C) Western blot analysis of SATB2 protein expression.

