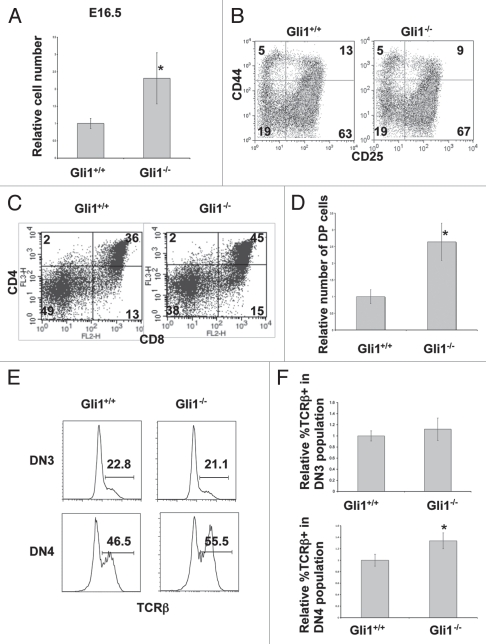
Figure 3.
Gli1−/− thymus on E16.5. (A) Relative cell number in E16.5 Gli1+/+ and Gli1−/− thymi, calculated as in Figure 1C. The E16.5 Gli1−/− thymus was significantly greater than WT (p = 0.018). (B) CD25 and CD44 expression in E16.5 DN thymocytes from Gli1+/+ and Gli1−/− littermates. Percentage of cells in each quadrant is given. Live cells were gated by FSC/SSC profile. Cells were stained with antibodies against CD4, CD8, CD3, CD25 and CD44. Cells that stained positive for anti-CD3, anti-CD4 and anti-CD8 were excluded. (C) CD4 and CD8 expression in thymocytes from E16.5 Gli1+/+ and Gli1−/− littermates. The percentage of cells in each quadrant is given. Live cells were gated by FSC/SSC profile. (D) The relative number of DP cells in E16.5 Gli1+/+ and Gli1−/− thymi. Relative cell number was calculated as described for Figure 1C to allow comparison between litters. The increase in relative number of DP cells in the Gli1−/− thymus was statistically significant (p = 0.001). (E) Intracellular TCRβ staining in DN3 and DN4 populations from E16.5 Gli1+/+ and Gli1−/− littermate thymi. Live cells were gated by FSC/SSC profile and cells that stained positive with antibodies directed against CD44, CD3, CD4 and CD8 were excluded. DN3 and DN4 populations were then gated by staining positively or negatively respectively with anti-CD25. (F) Bar charts show the mean relative percentage of icTCRβ positive cells in the E16.5 DN3 (upper chart) and DN4 (lower chart) Gli1−/− and WT thymus. Relative percentage was calculated as described in Figure 1B, to allow comparison between litters. There was no significant difference between genotypes in the DN3 population, but the relative mean % icTCRβ+ was significantly greater in the Gli1−/− DN4 population compared to WT (p = 0.0017).

