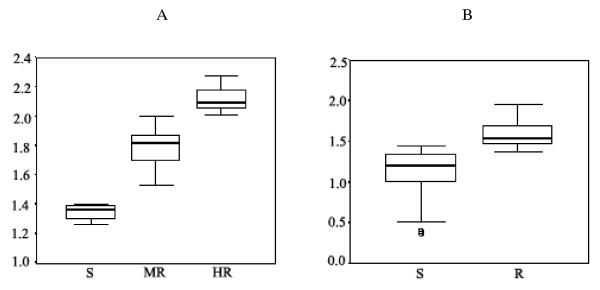
Figure 1.
Box plot between logIC50 and the order of drug susceptibility. A: CQ was categorised into high resistance (HR: IC50 >101 nM), moderate resistance (MR: 30.9 <IC50 ≤ 100.9 nM) and sensitive (S; IC50 ≤ 30.9 nM). B: MQ was divided into 2 groups; resistant (R; IC50 >24 nM and sensitive (S; IC50 ≤ 24 nM)

