
Fig. 1.
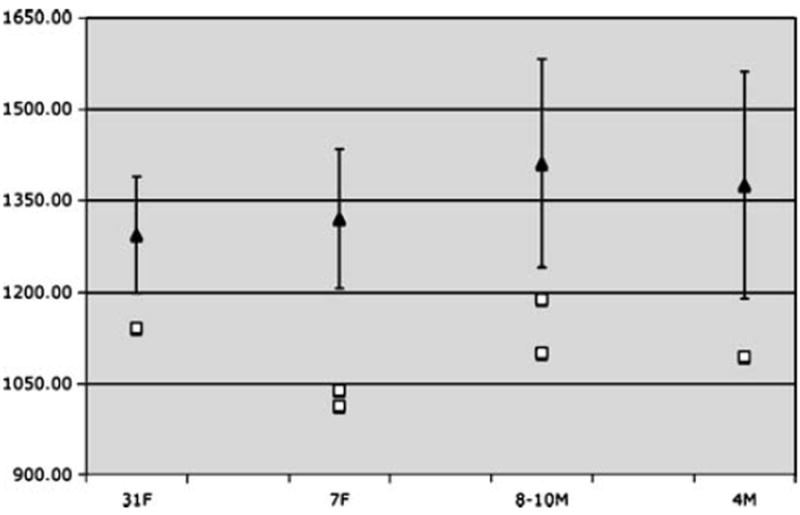
Mean typically developing control (black triangles with SD bars) and individual CLS (white squares) total brain volumes (shown in cm3) showing marked reduction in the CLS subjects compared to age- and gender-matched controls. 31F 31-year-old carrier woman; 7F 7-year-old carrier female children; 8–10M 8- and 10-year-old affected male children; 4M 4-year-old affected male child