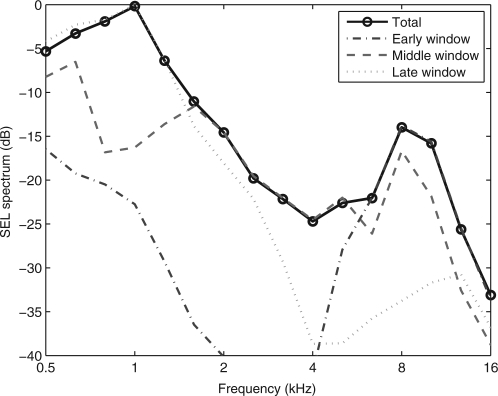
Figure 3.
(Color online) For the test ear of subject 1, the third-octave averaged signal levels are plotted as a SEL in decibels for each windowed spectrum and for the total spectrum (solid line with circles) calculated using SNR weightings. The early-windowed spectrum (dashed–dotted line) is peaked at high frequencies, the middle-windowed spectrum (dashed line) at intermediate frequencies, and the late-windowed spectrum (dotted) at low frequencies. The portion of the early-windowed SEL spectrum below −40 dB, which occurs between 2 and 4 kHz, is not plotted.

