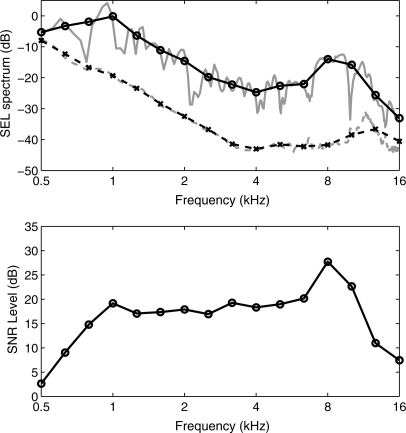
Figure 4.
Top panel: For the test ear of subject 1, the third-octave averaged total signal level (black solid line) and noise levels (black dashed line) are each plotted as a SEL in decibels. This total signal SEL is the same response plotted in Fig. 3. Also plotted are the detailed signal and noise levels without frequency averaging (gray lines with similar styles). Bottom panel: The CEOAE SNR level is plotted as the difference in the third-octave averaged signal and noise levels shown in the top panel.

