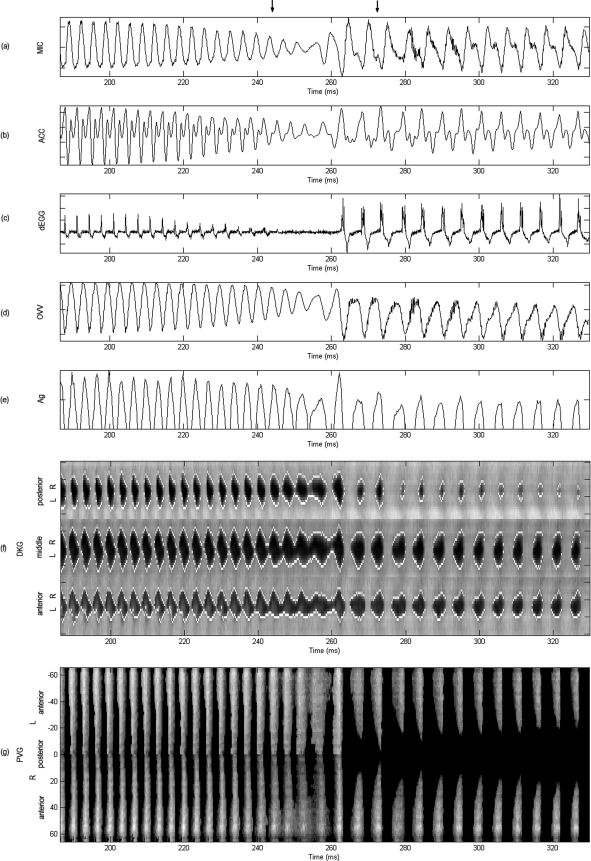
Figure 7.
Acoustically induced bifurcation. Synchronous plots for vowel ∕i∕ selected from the interval indicated in Fig. 3: (a) microphone, (b) accelerometer, (c) derivative of electroglottograph, (d) oral volume velocity, (e) glottal area, (f) anterior, middle, and posterior kymograms, and (g) phonovibrogram. All signals normalized. The normalized PVG grayscale indicates maximum amplitude in white. Upper arrows bound the bifurcation region shown in the HSV sequence of Fig. 5. Reduced vocal fold contact, parallel vocal fold motion, and increased glottal excursion followed by a sudden register transition are observed in this region. Most signals exhibit an aperiodic component after the bifurcation.

