Figure 2.
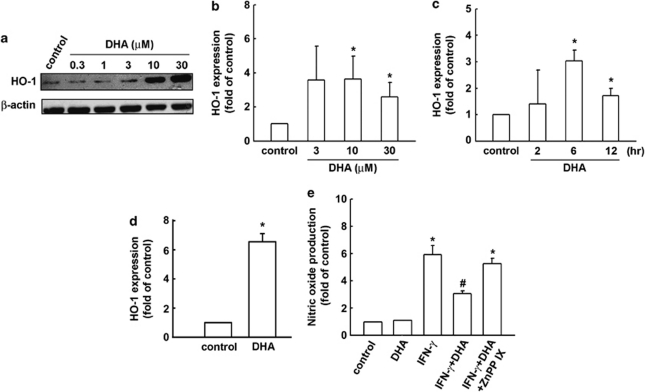
DHA induces HO-1 upregulation in BV-2 microglia cells. (a) BV-2 cells were stimulated with various concentrations of DHA for 24 h. Whole-cell lysates were subjected to western blot analysis using an antibody against HO-1. Cells were stimulated with various concentrations of DHA for 6 h (b) or stimulated with DHA (30 μM) for indicated time periods (c). Rat primary cultured microglia were stimulated with DHA (30 μM) for 6 h (d). The mRNA level of HO-1 was analyzed using real-time PCR. Results are expressed as the mean±SEM of four independent experiments. (e) Cells were pretreated with ZnPPIX (10 μM) for 30 min and treated with DHA for another 30 min before IFN-γ (30 μg/ml) application. NO production was analyzed using Griess reaction. Note that ZnPPIX effectively antagonized IFN-γ-induced NO production. Each bar represents means±SEM from at least four independent experiments. *p<0.05 compared with the control group; #p<0.05 compared with the IFN-γ treatment group.

